The School Funding (Wales) Regulations 2010 are very clear—local authorities "must take into account in their formula a factor or factors based on the incidence of social deprivation among pupils registered at all such schools."
In order to comply, local authorities use the free school meal rate to calculate the incidence of social deprivation and every authority adds a factor to the formula to increase a school's budget based on the number of children at that school in receipt of free school meals.
But in 15 of the 22 authorities that factor is having little to no influence on funding levels at schools.
We plotted free school meal rates for each primary school in each authority against the per pupil funding level for that school.
In Rhondda Cynon Taf there's a clear relationship between FSM rate and per pupil funding.
But in Denbighshire, there is no correlation.
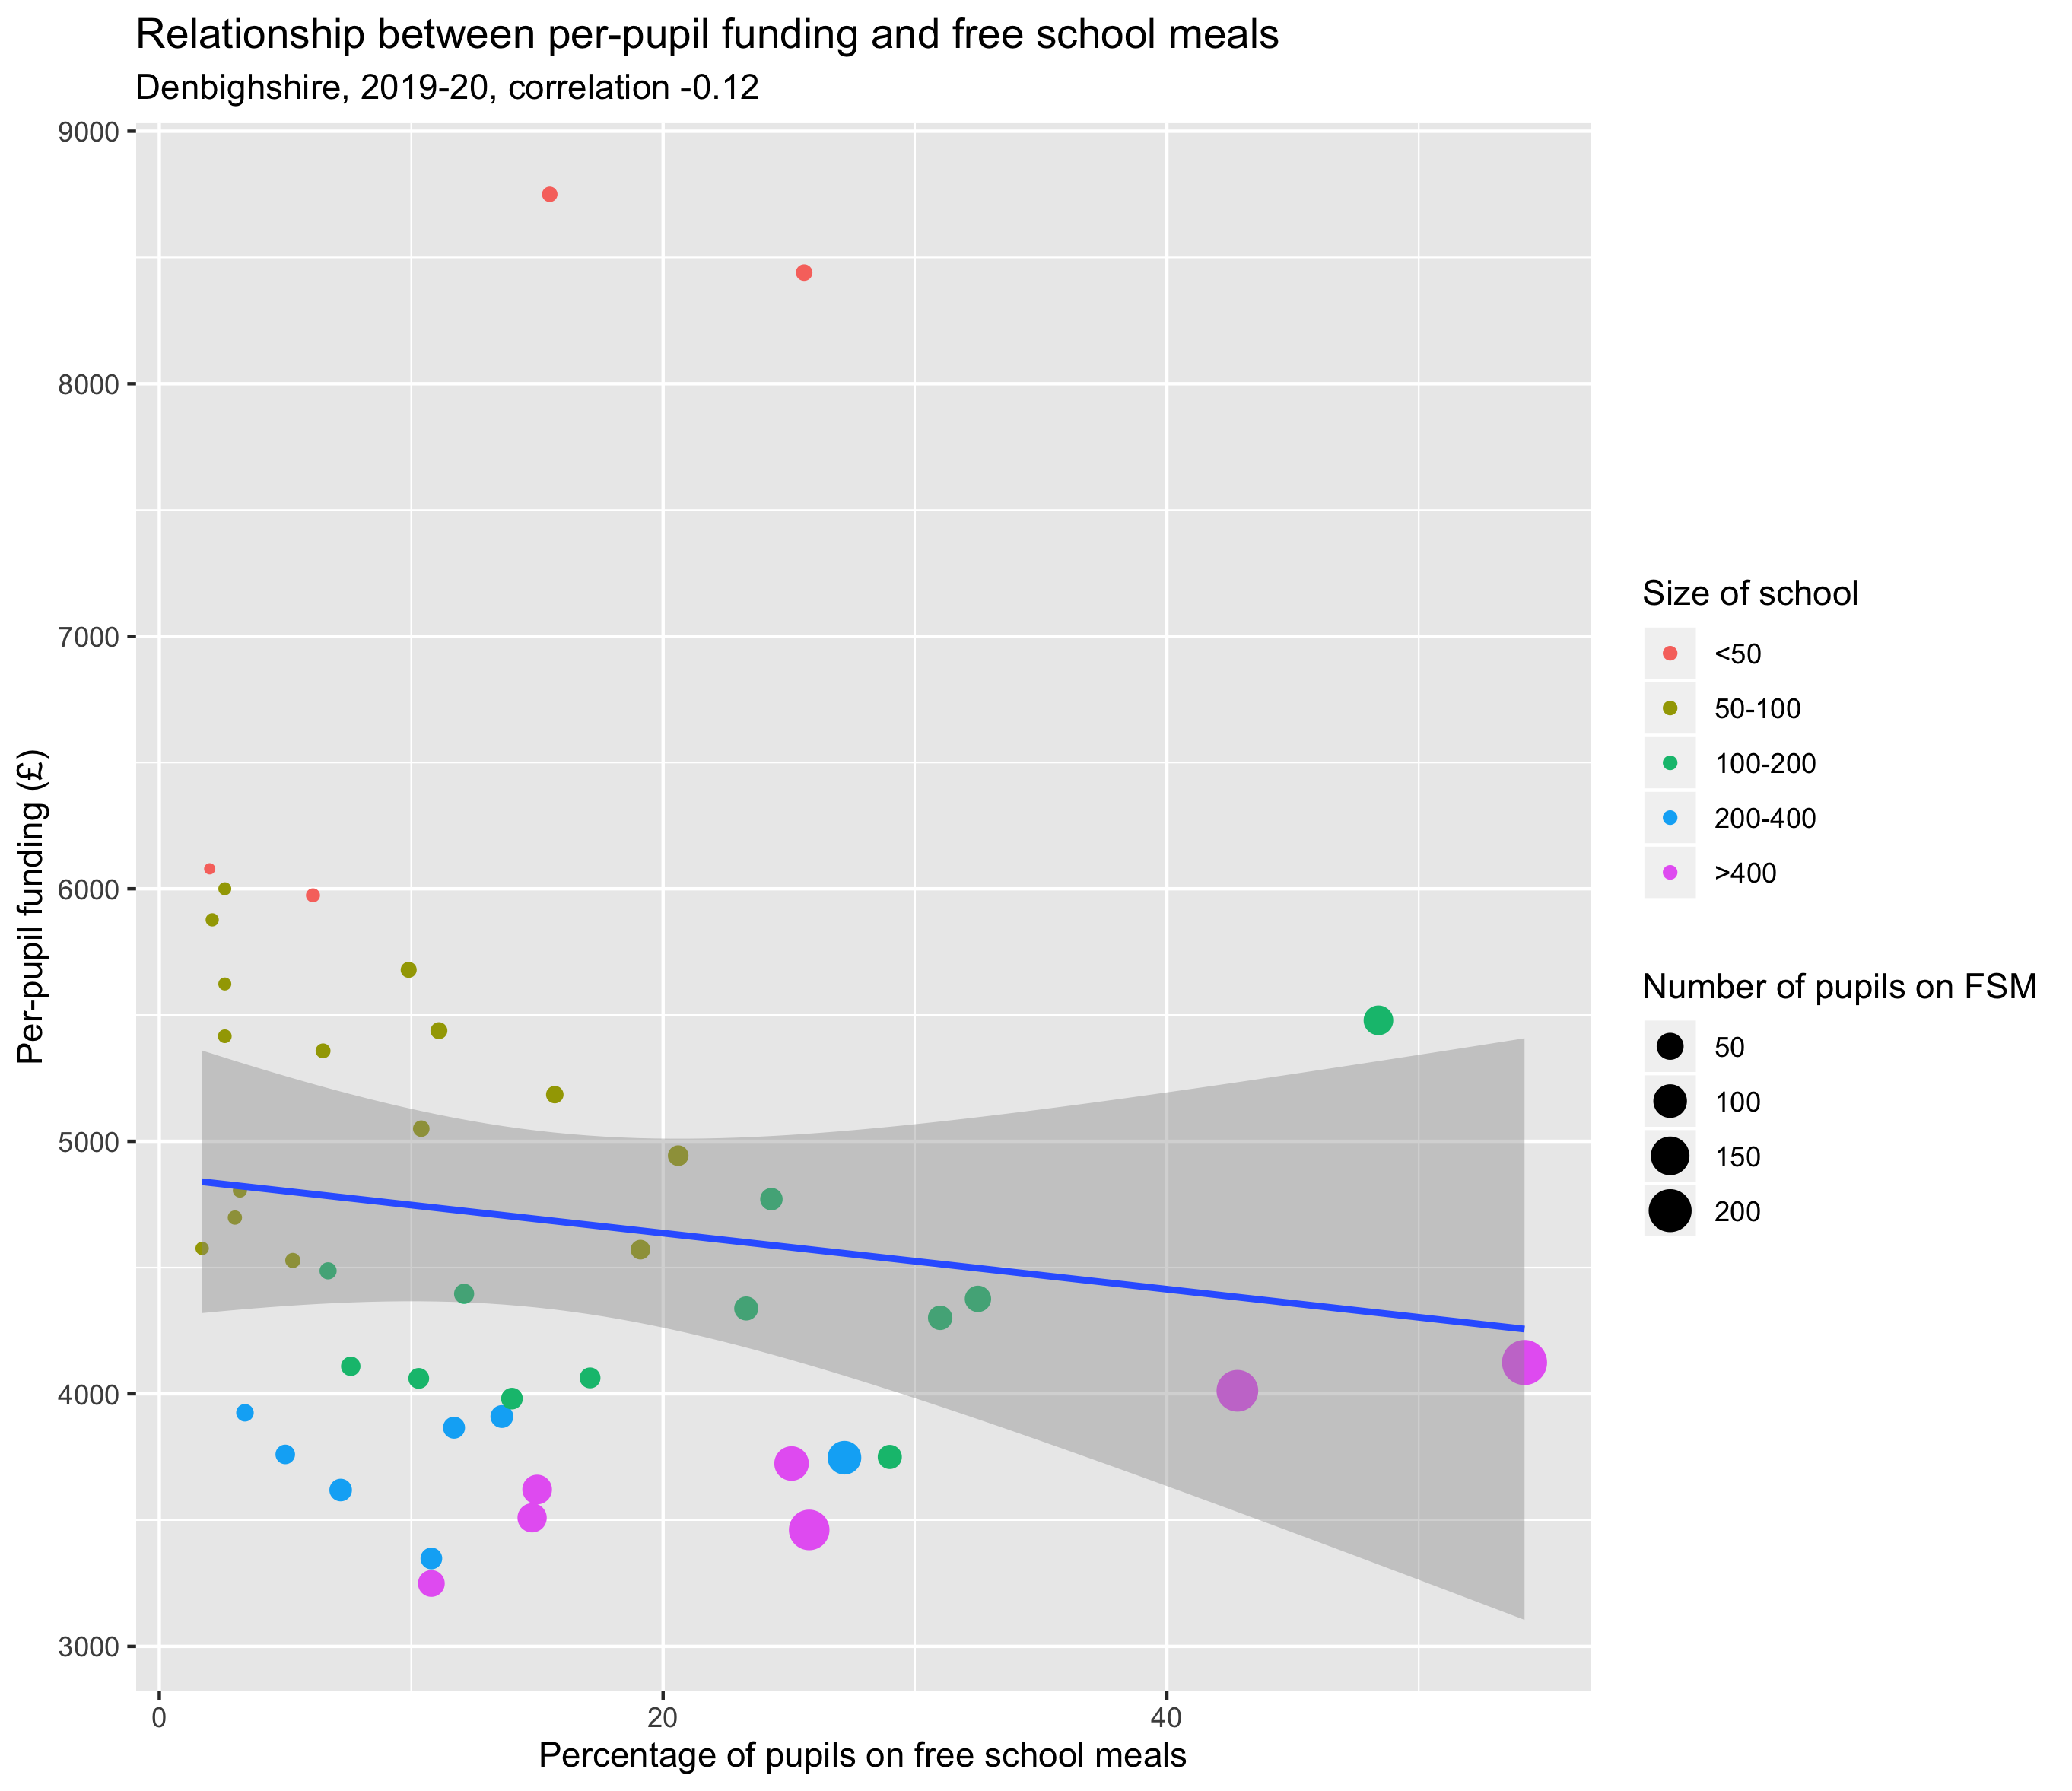
Six authorities show no correlation: Conwy, Denbighshire, Flintshire, Powys, Vale of Glamorgan and Wrexham.
Nine show a weak correlation: Cardiff, Carmarthenshire, Ceredigion, Gwynedd, Isle of Anglesey, Merthyr Tydfil, Neath Port Talbot and Pembrokeshire.
Are LAs testing the effect of their funding formulae to ensure they work as intended?
Does Welsh Government carry out analysis to ensure the local authorities' funding formulae and policies are compliant with the regulations?
This year, children and schools in some of Wales’ most deprived communities are losing out, because funding formulae in two thirds of local authorities aren't having the impact they are meant to.
There's still time to adjust funding for next year.
Follow the links below and you can see what free school meal rates are like in your area on a map and see the plot for each authority.
Blaenau Gwent … Bridgend … Caerphilly … Cardiff … Carmarthenshire … Ceredigion … Conwy … Denbighshire … Flintshire … Gwynedd … Isle of Anglesey … Merthyr Tydfil … Monmouthshire … Neath Port Talbot … Newport … Pembrokeshire … Powys … Rhondda Cynon Taf … Swansea … Torfaen … Vale of Glamorgan … Wrexham
Note: 0.6 to 1 = strong positive correlation; 0.4 to 0.6 = moderate positive correlation; 0.15 to 0.4 = weak positive correlation; -0.15 to 0.15 = no correlation; -0.15 to -0.4 = weak negative correlation; -0.4 to -0.6 = moderate negative correlation; -0.6 to -1 = strong negative correlation.